Dashboards that turn data into decisions.
Our dashboard design and data visualization service covers KPI dashboards, BI tools, and analytics interfaces — built so your team can read the data and act on it immediately.
Trusted by leading brands

Surfaces we design
Every metric,
exactly where it matters.
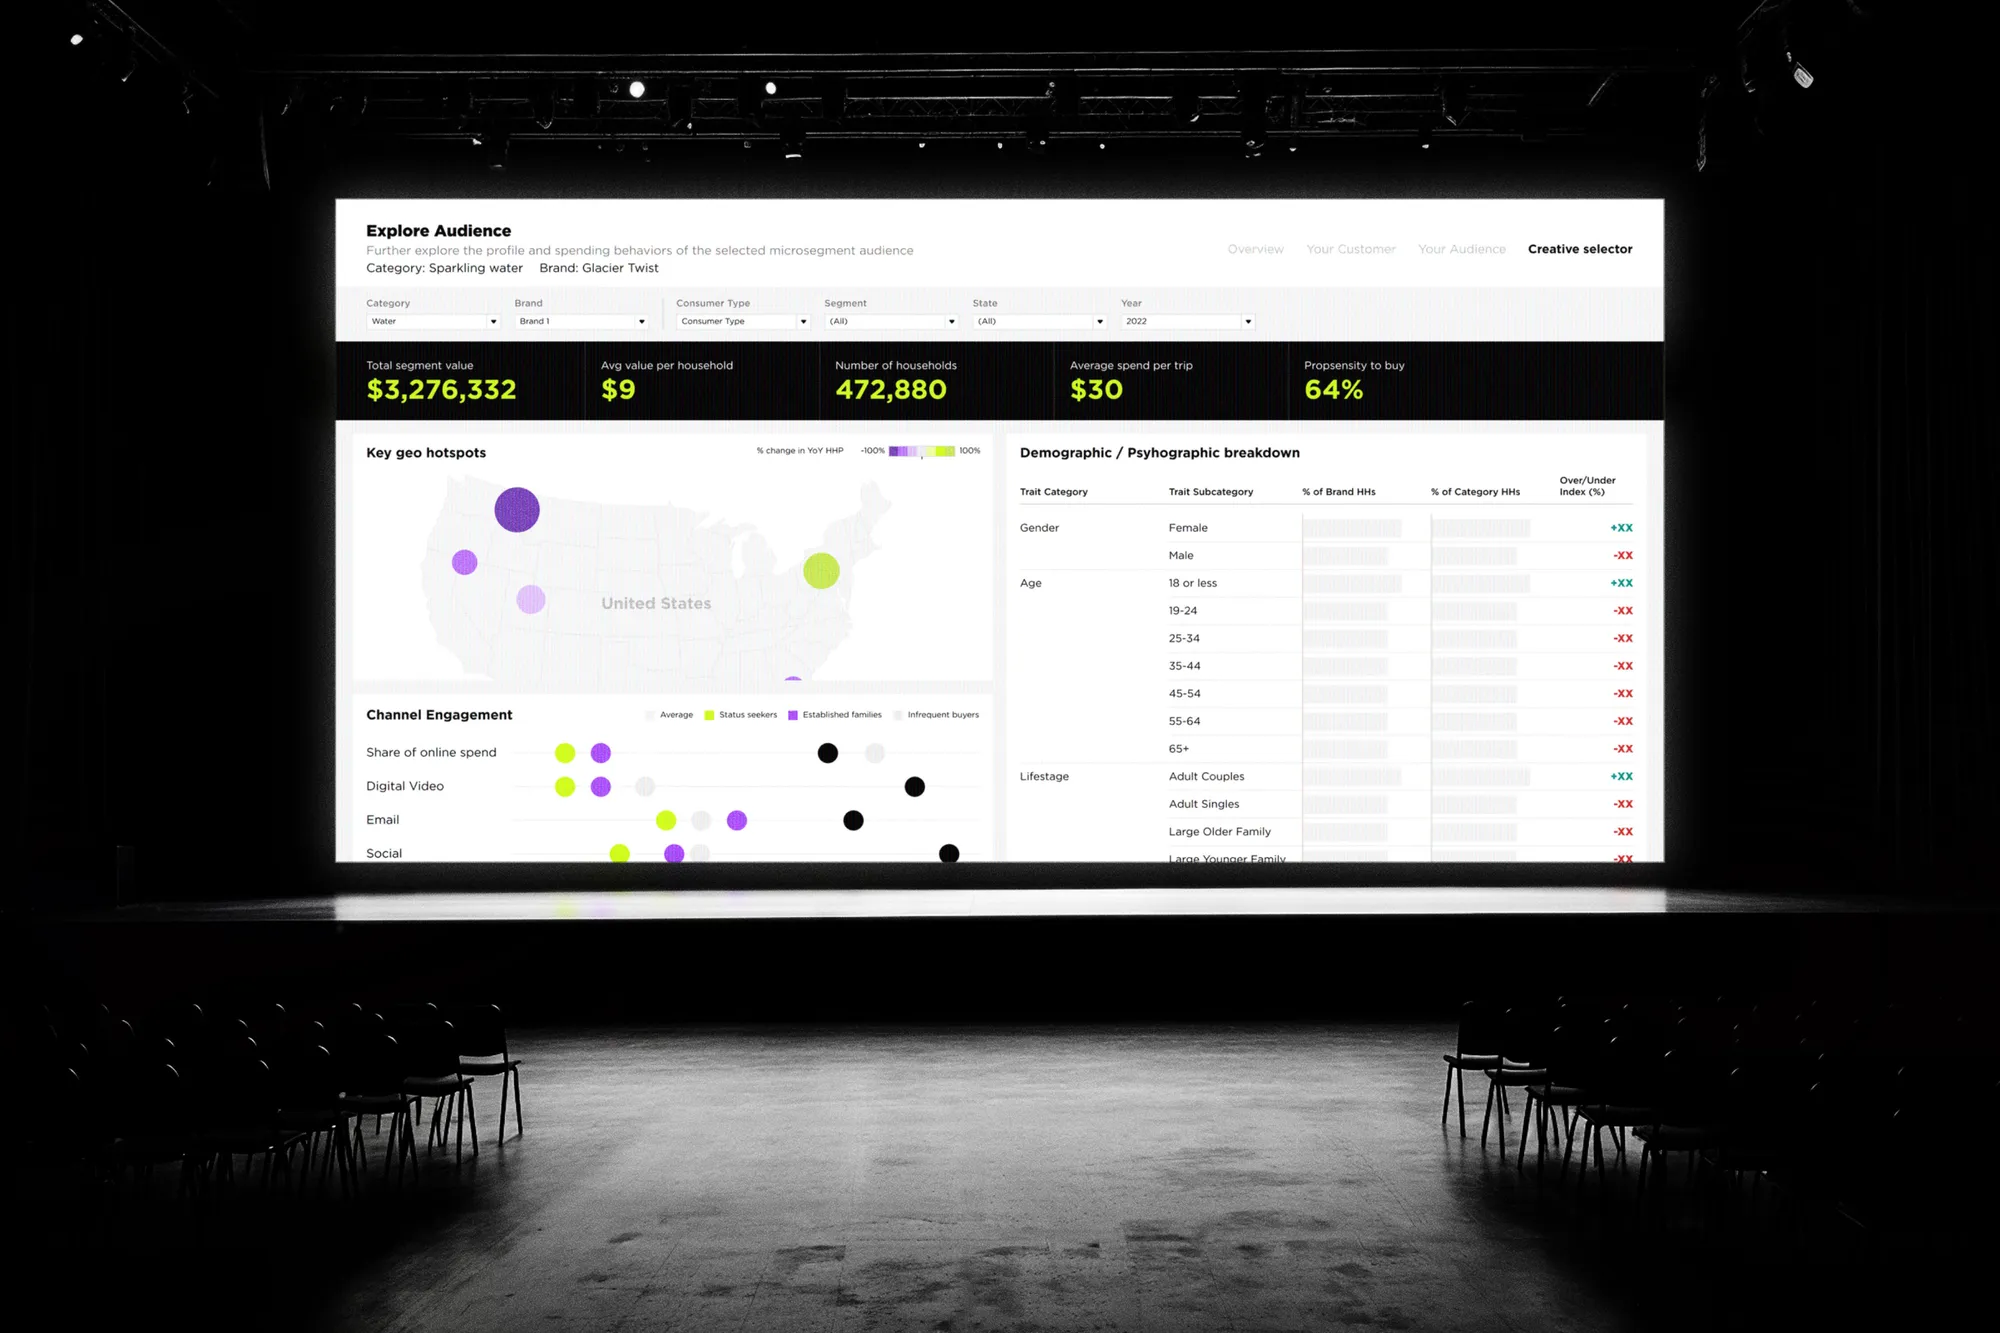
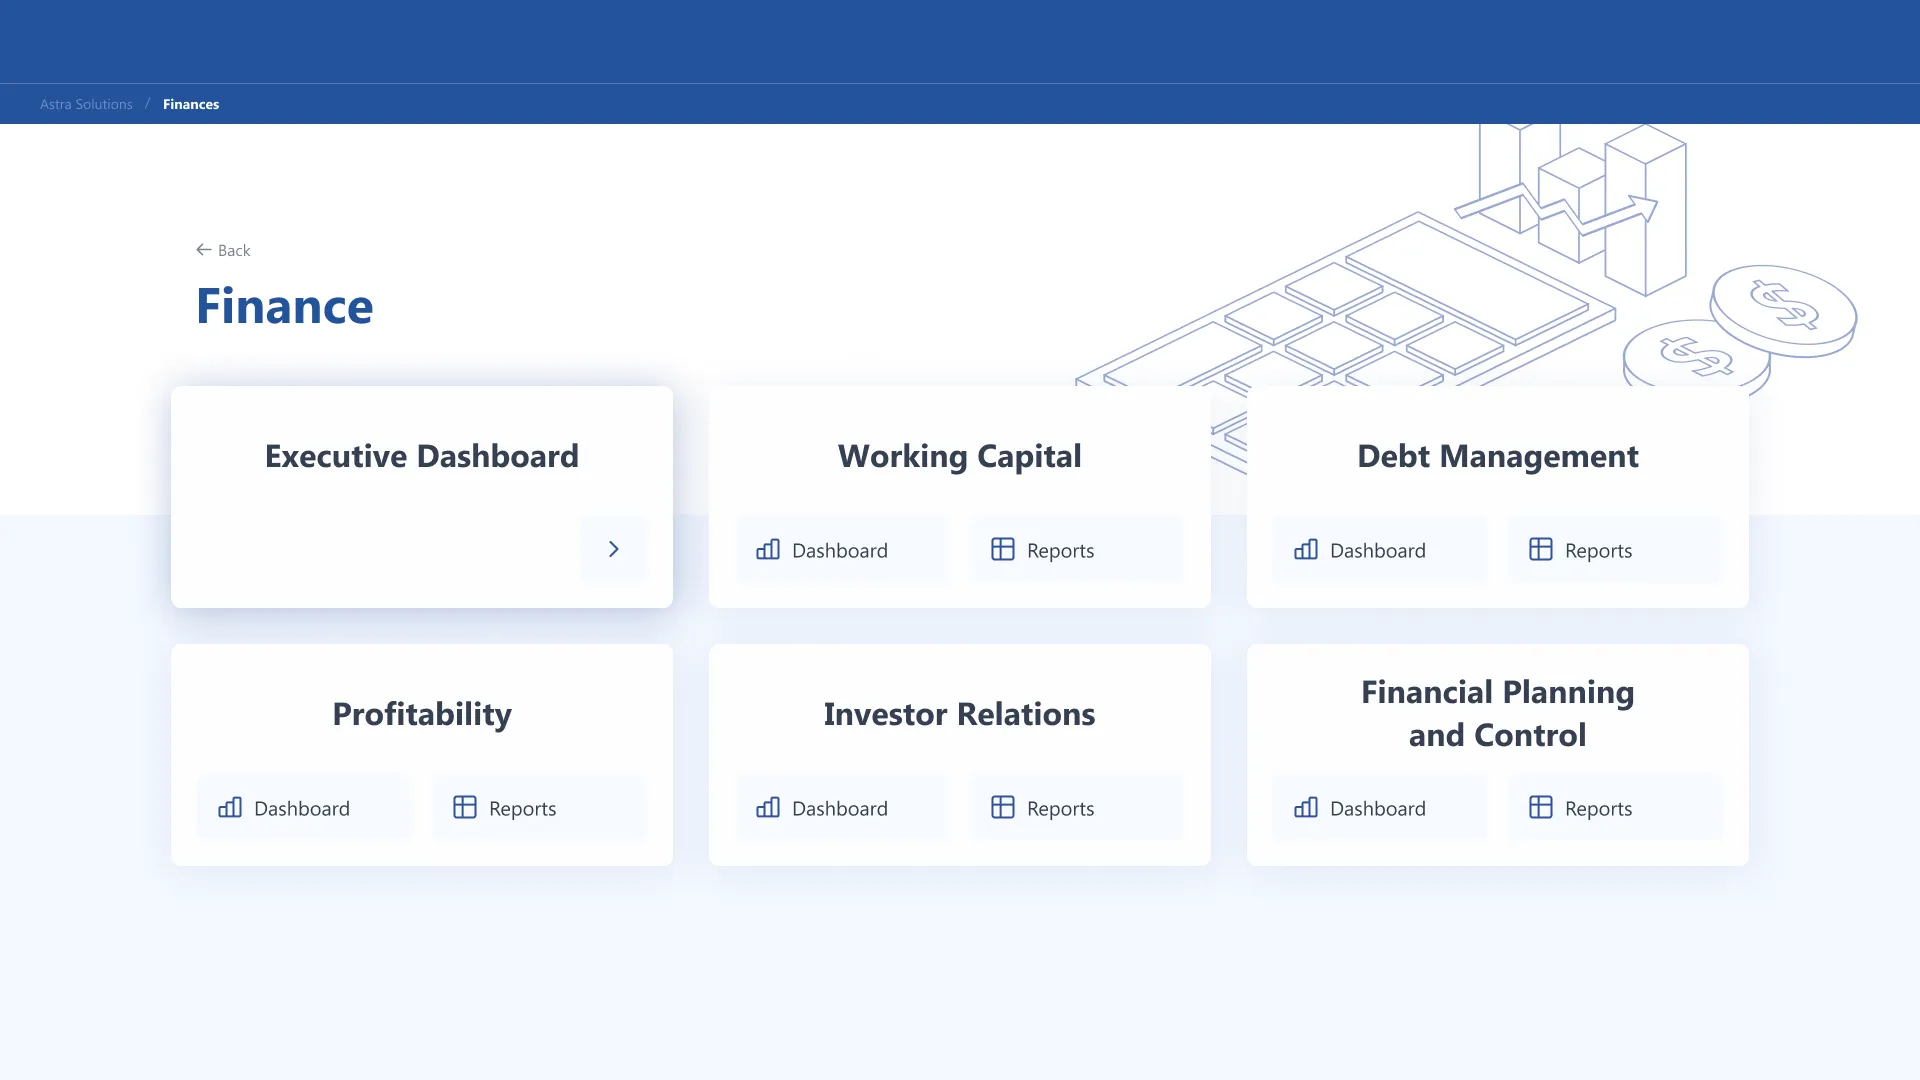
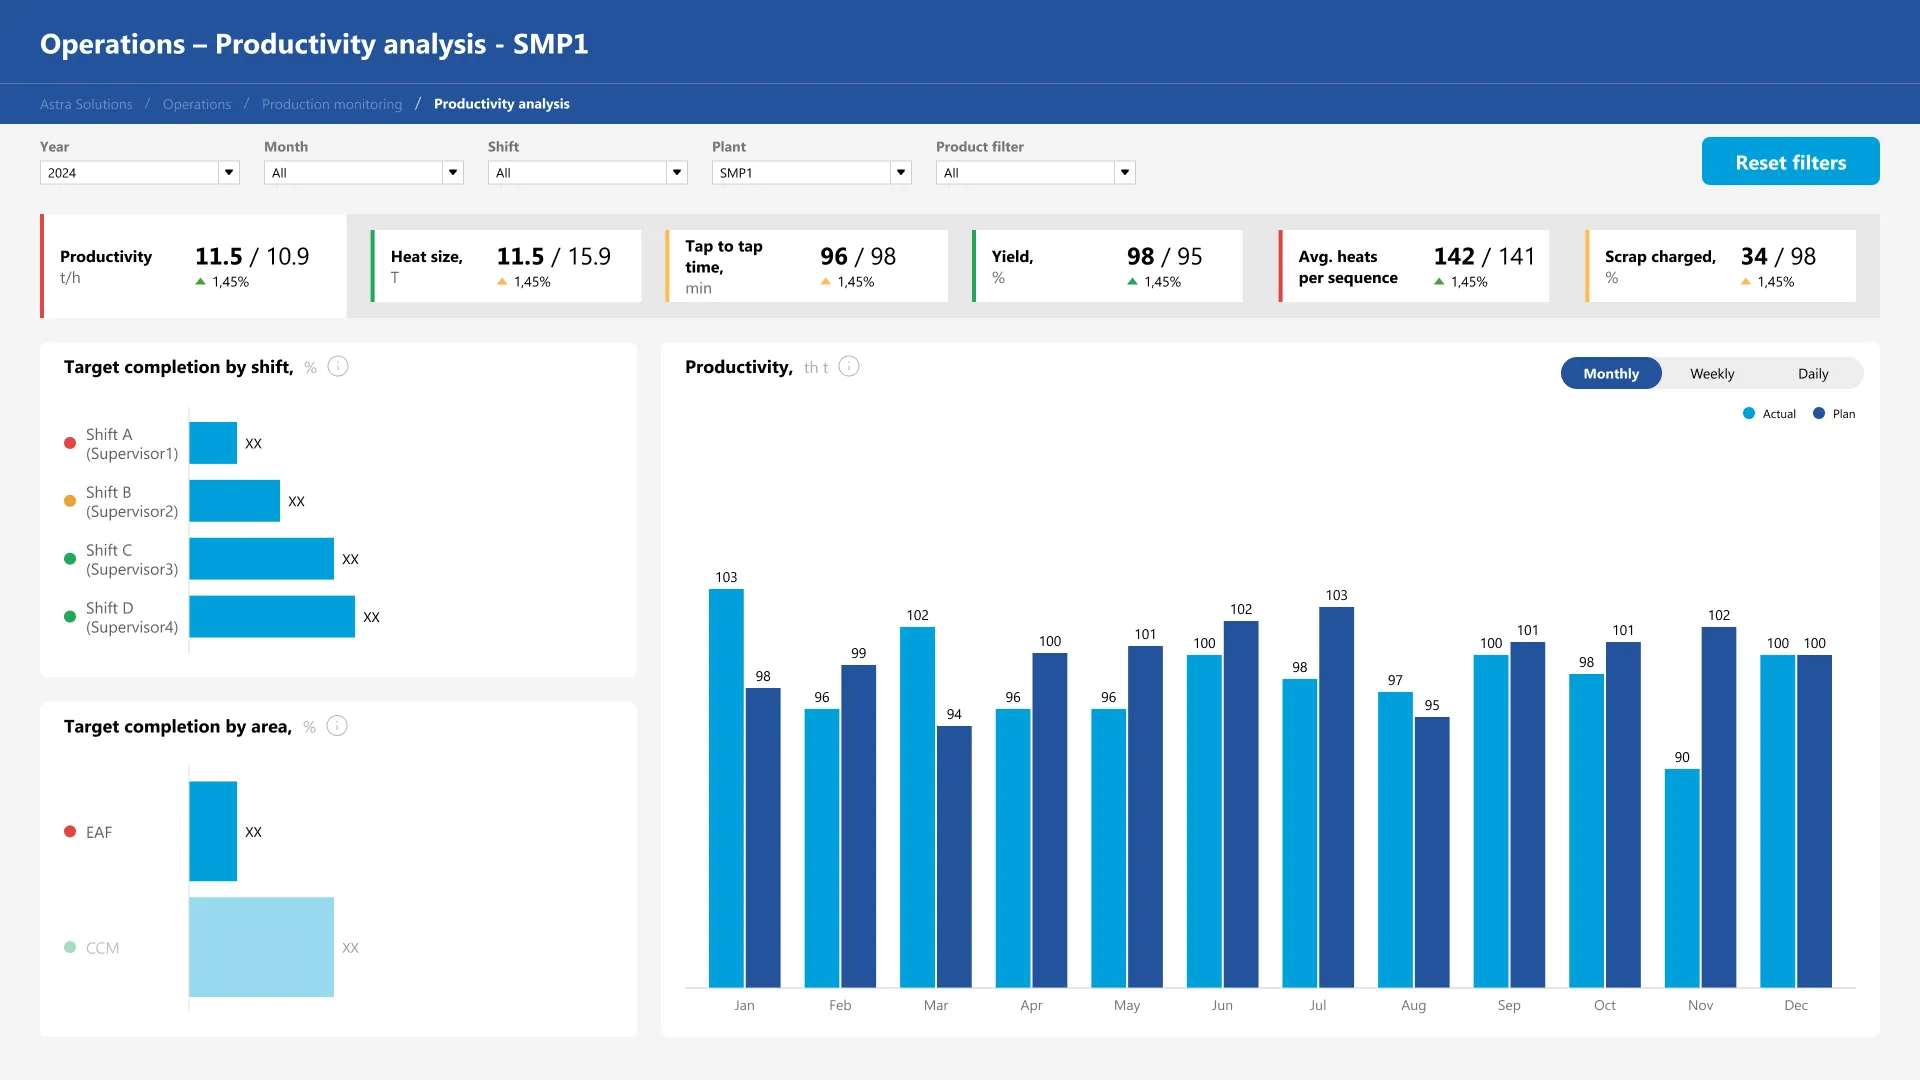
Executive overviews, real-time ops, BI deep-dives, mobile summaries, and embedded analytics — designed to be read in seconds, trusted by leadership, and shipped on your existing stack.
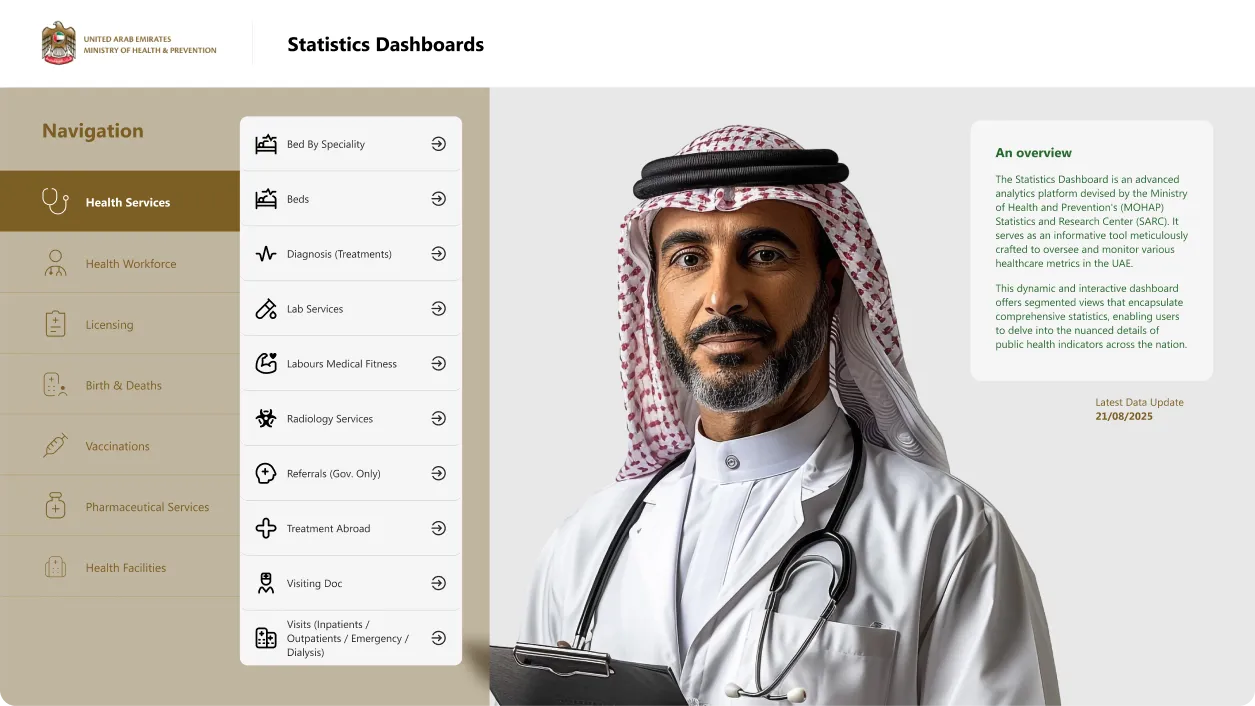
C-Level · KPI Overview
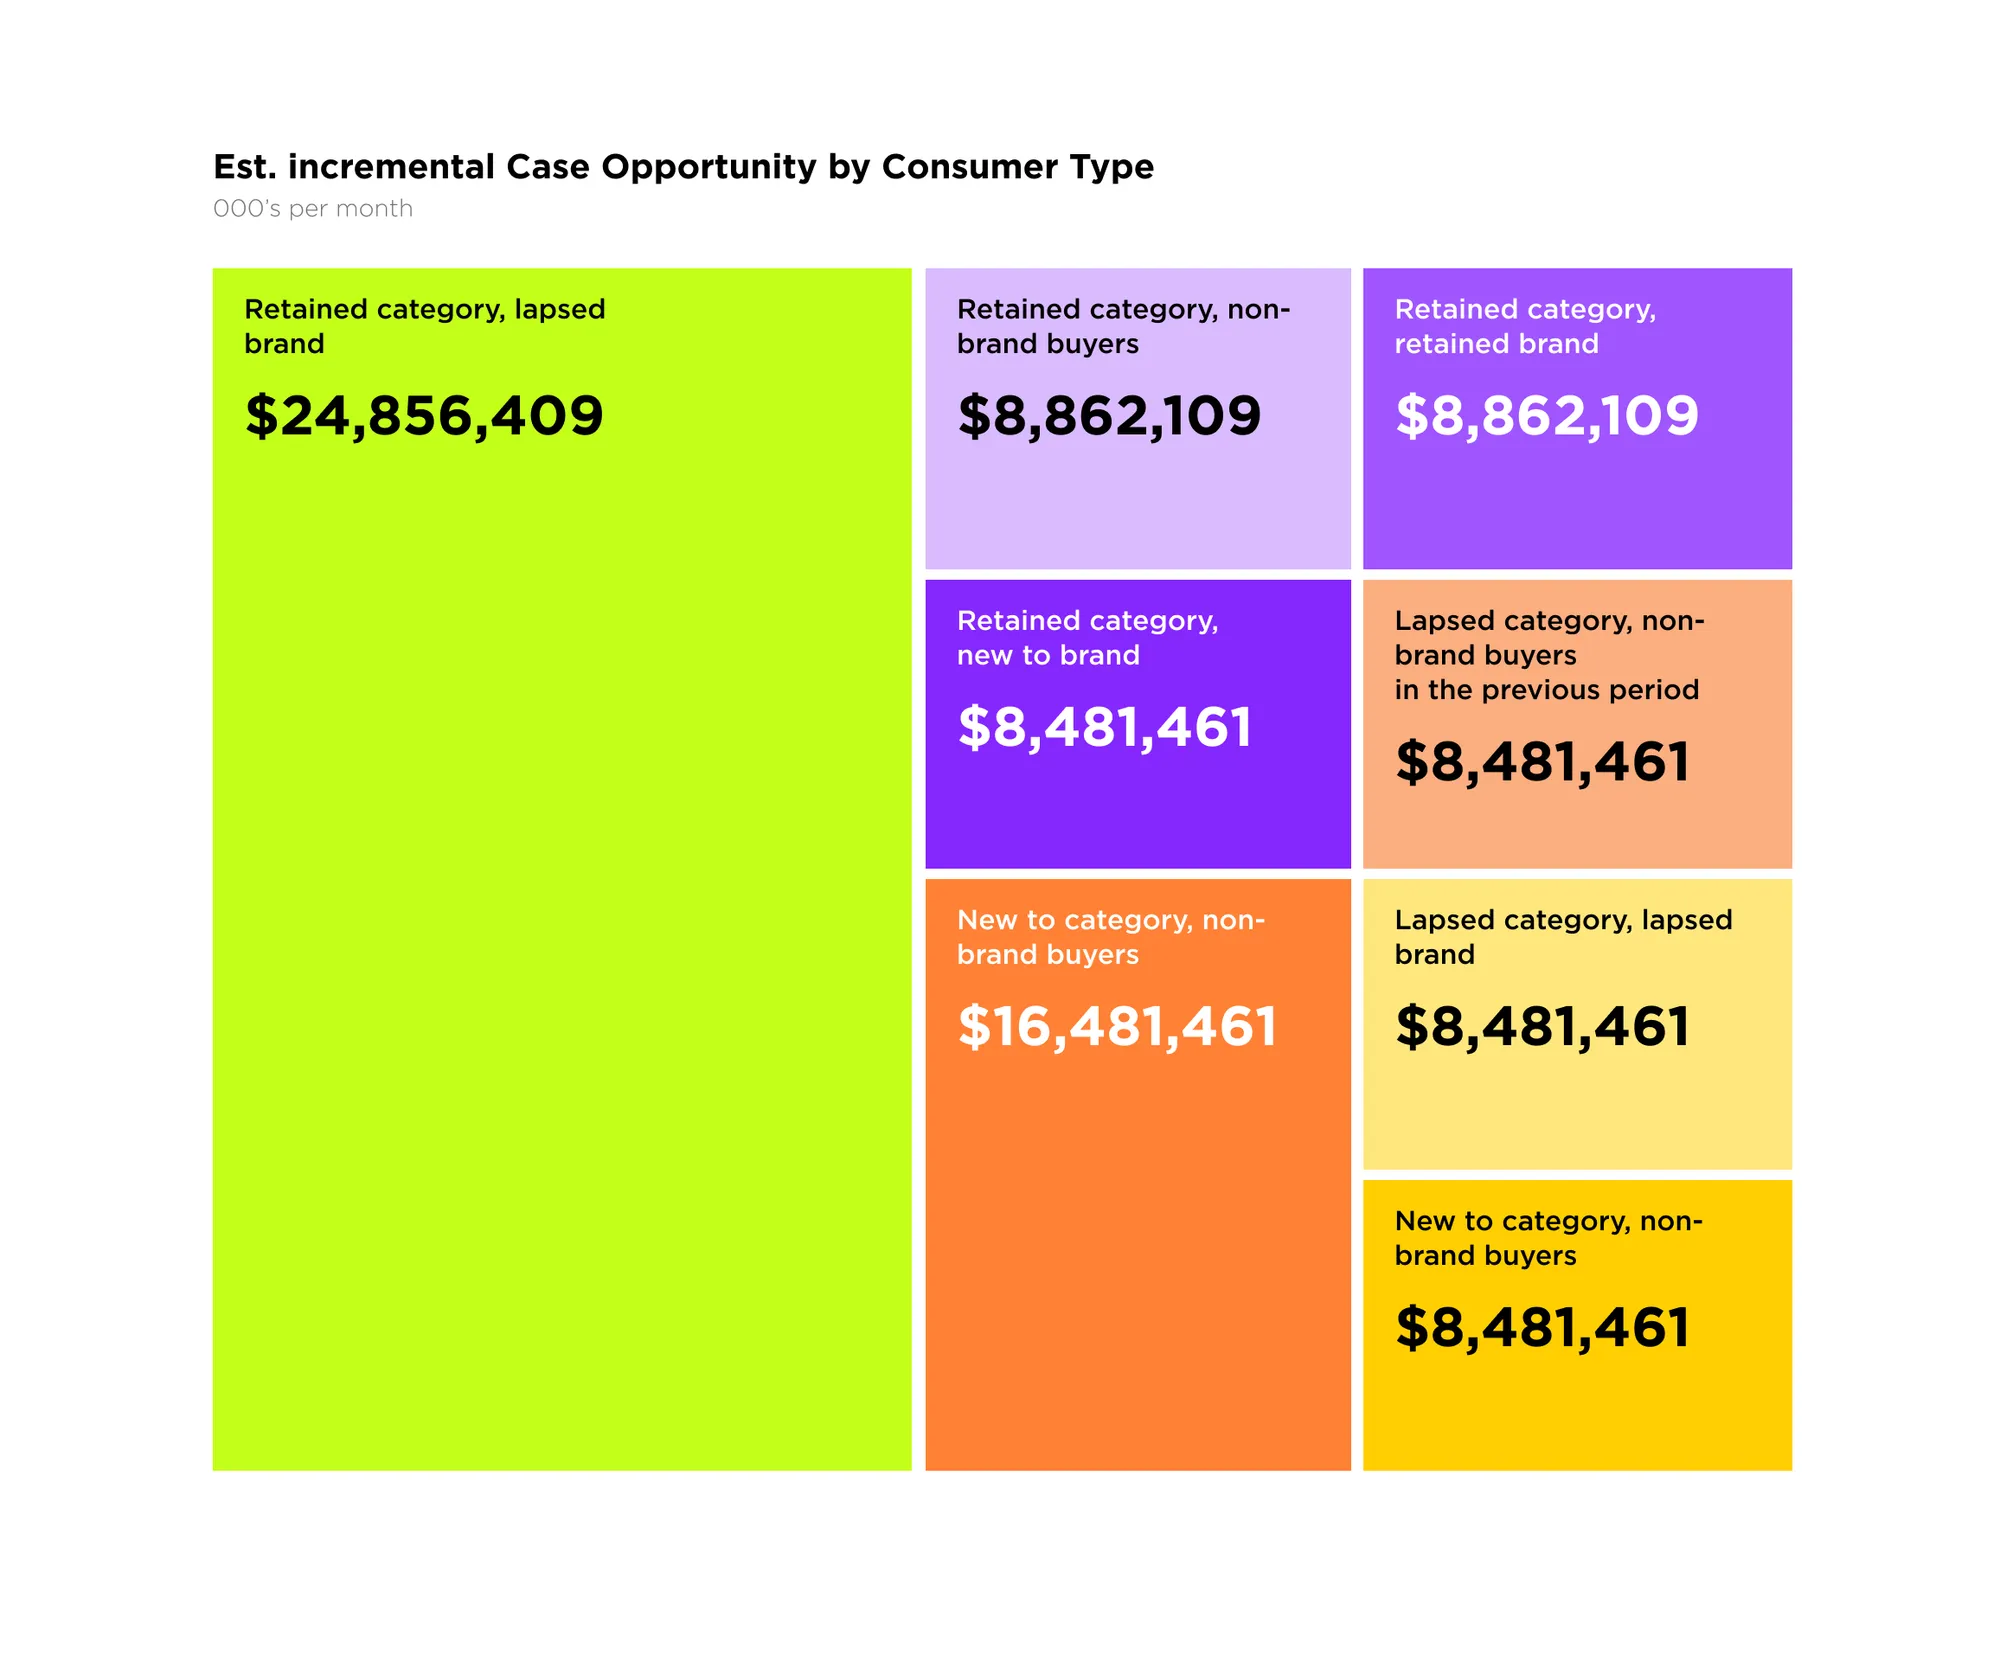
Charts · Comparison Logic
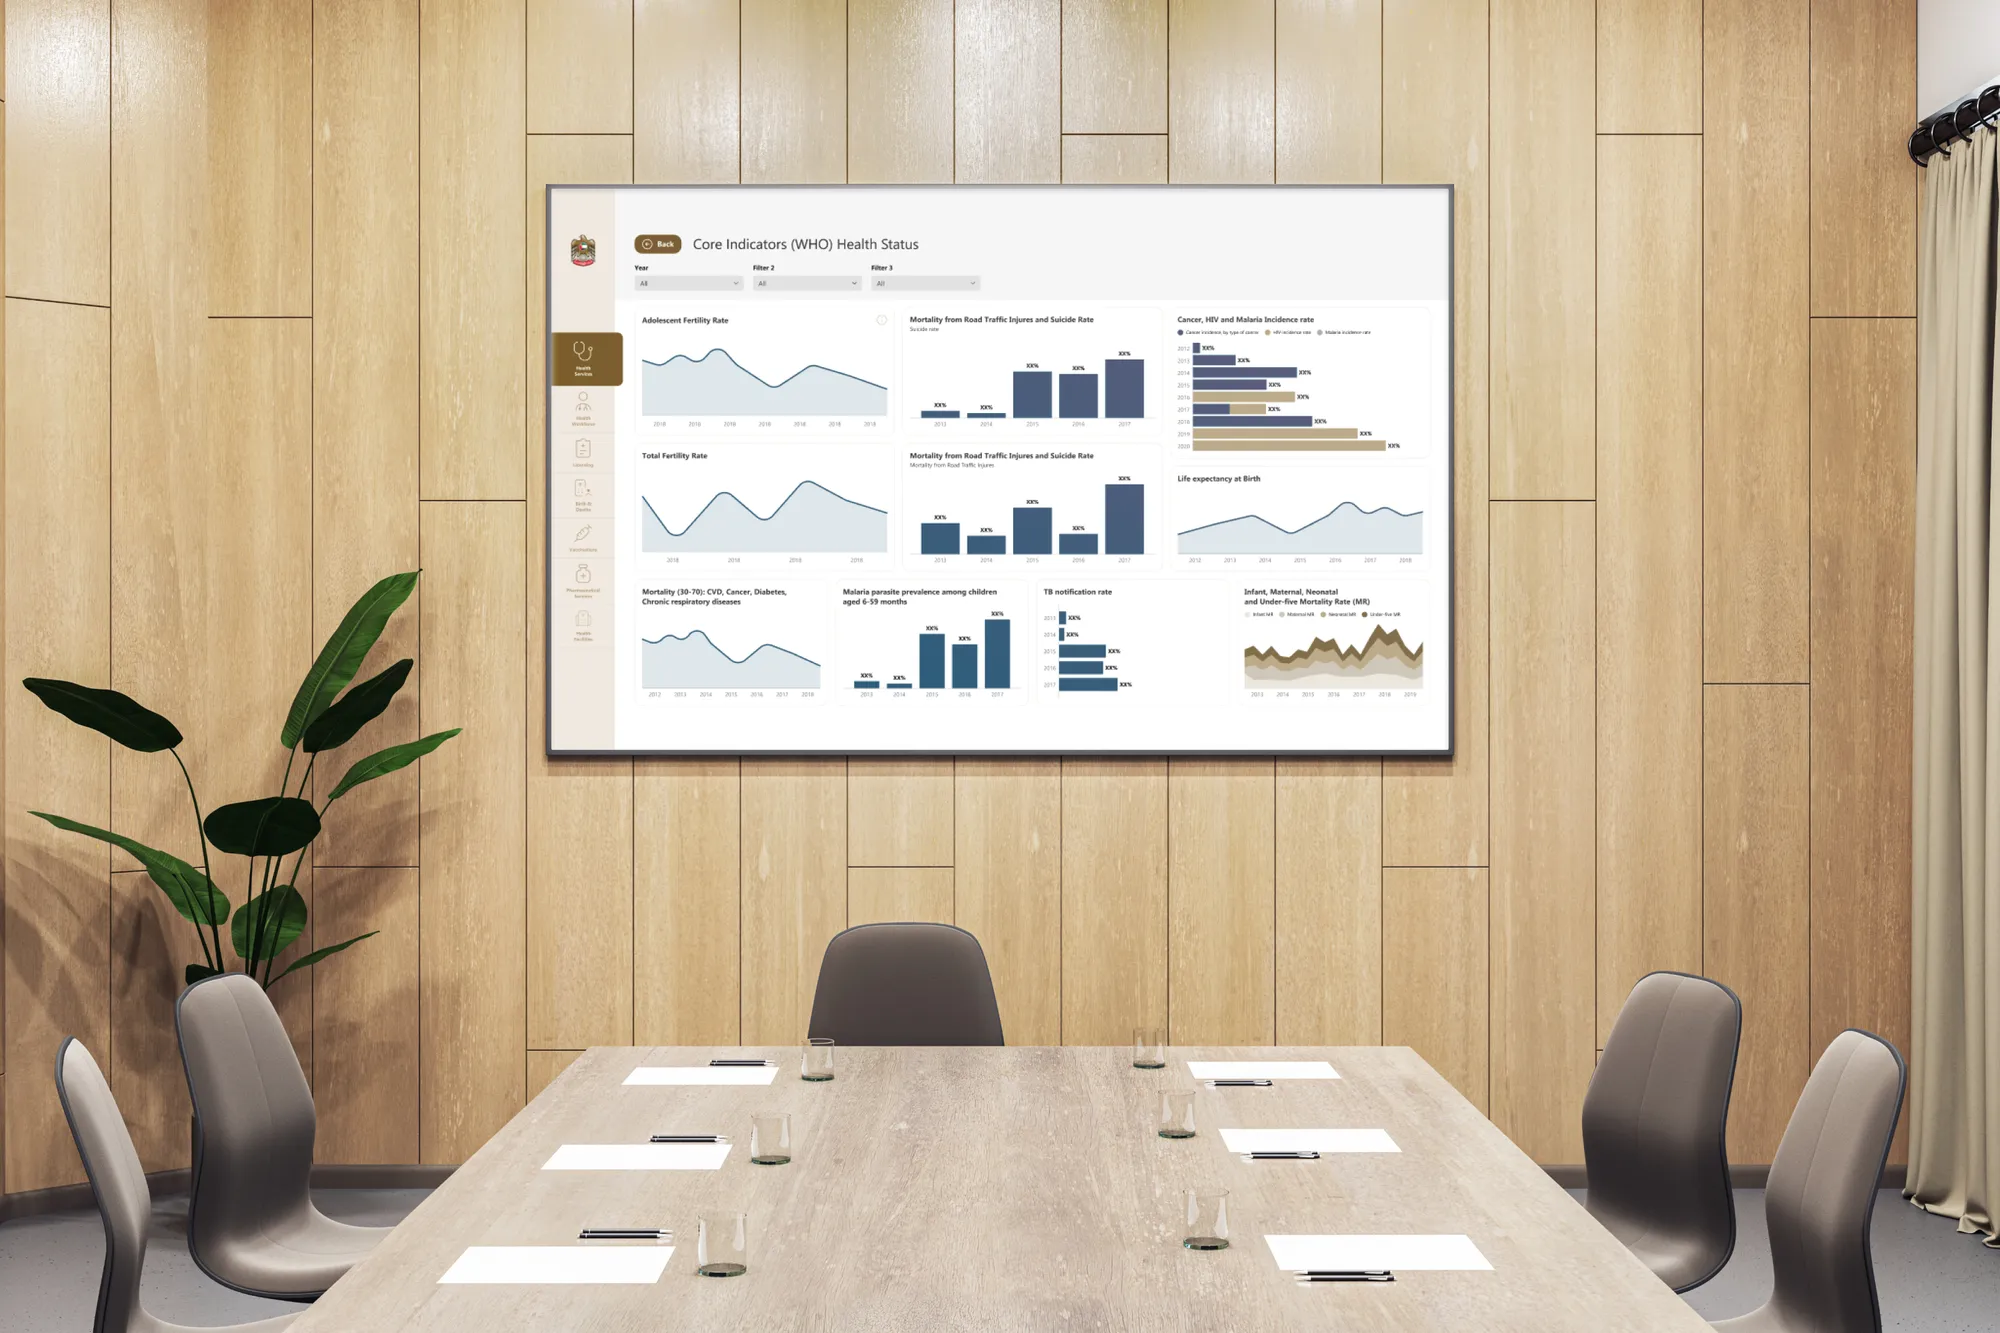
Statistics · Cohort Data
Weekly Review · Performance
Drill-Down · Business Insights
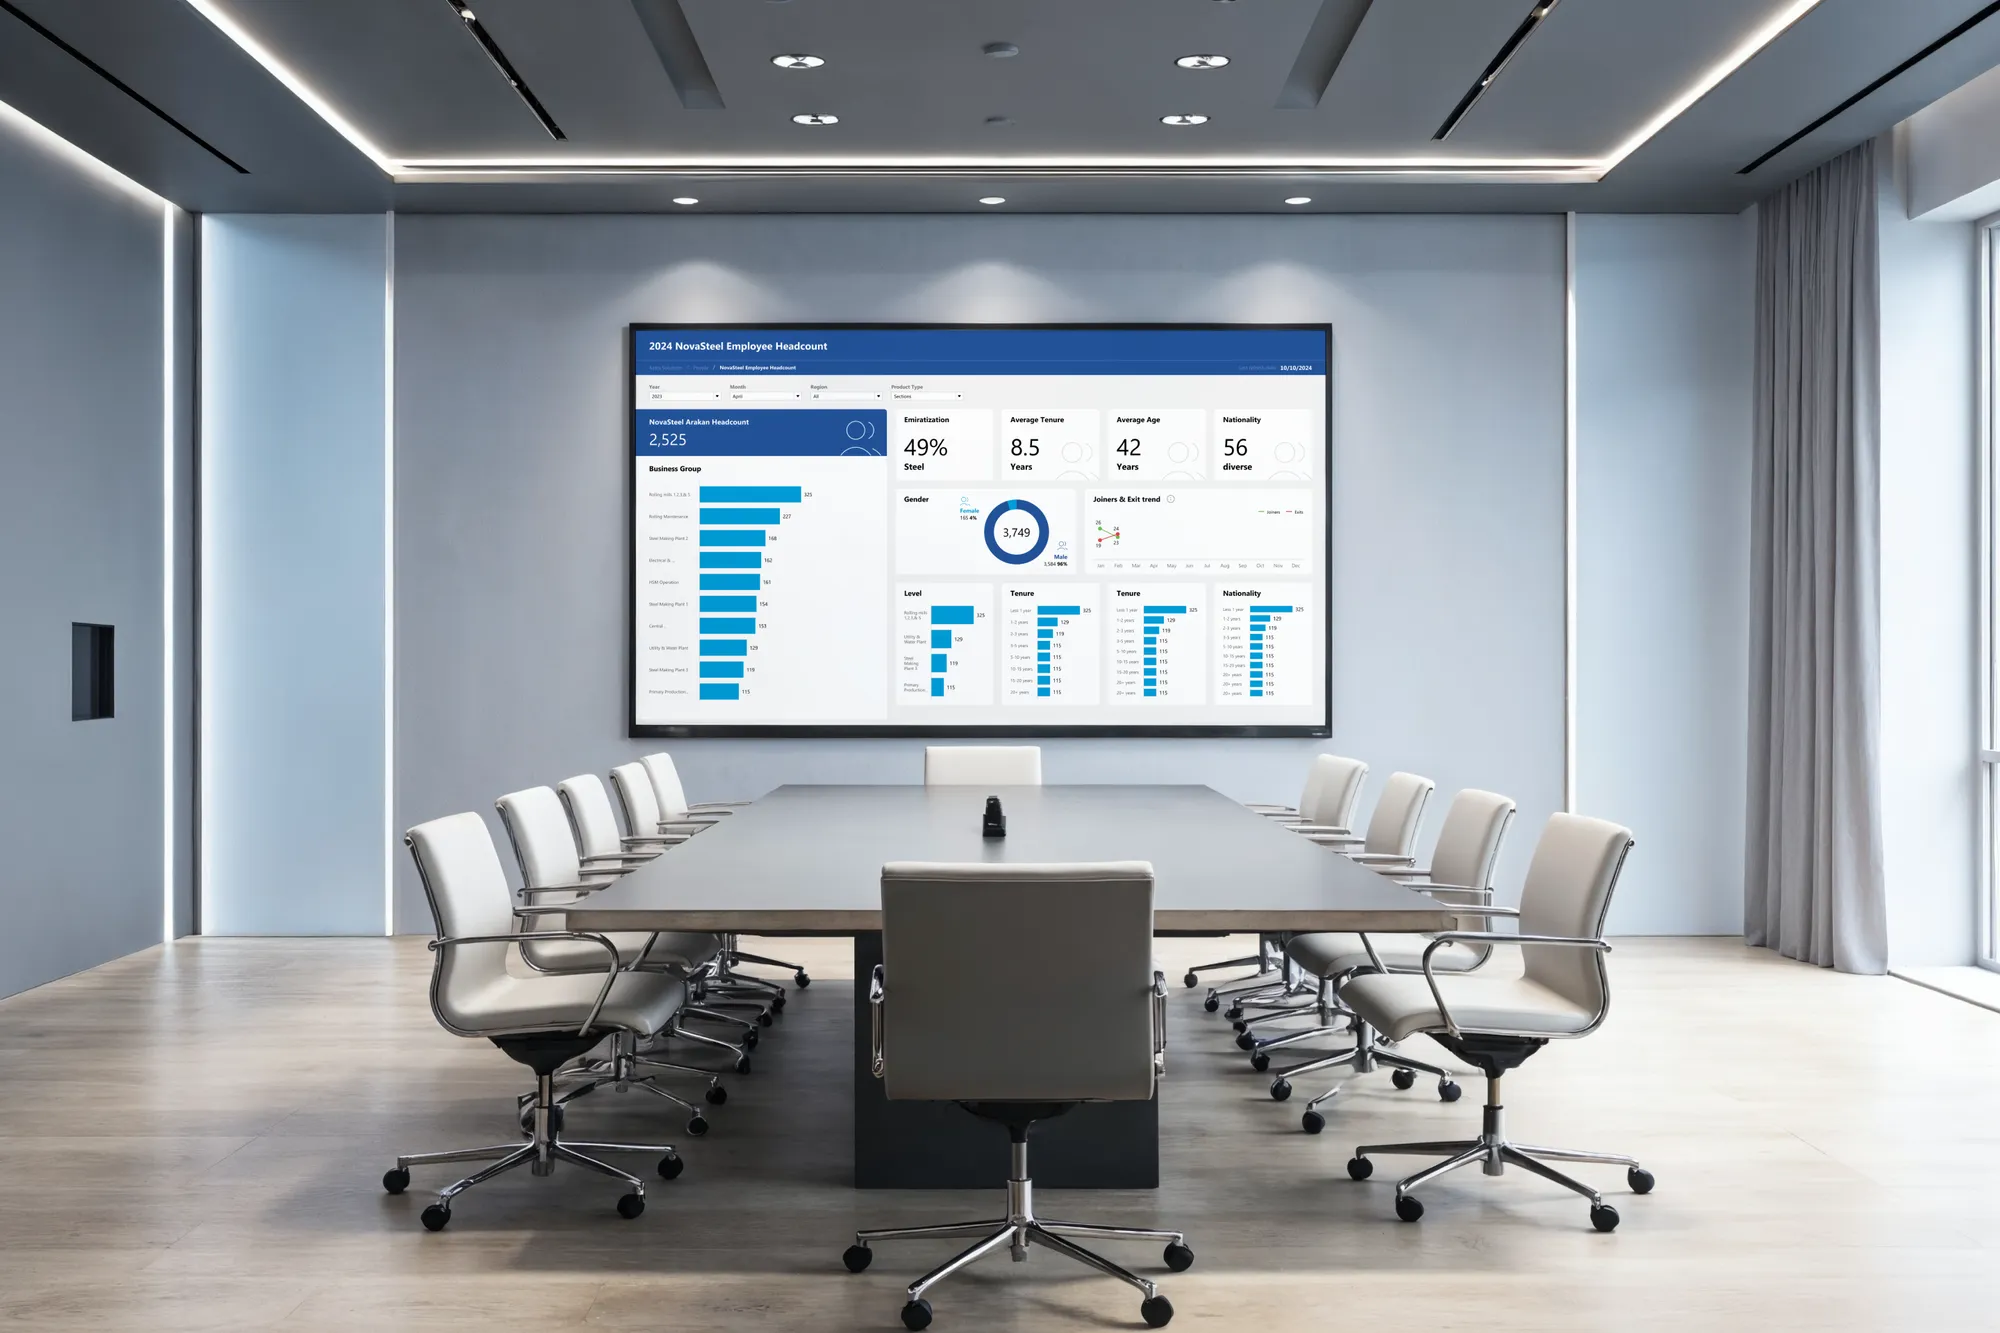
Operations · Real-Time Metrics
Management View · Actionable Data
Before · After
From data overload to a single signal.
Most teams don't lack data — they lack a place where the answer is obvious. We design dashboards around the decisions you actually need to make.
Today
Drowning in charts, still waiting for the answer
- Twenty charts, no clear answer
- KPIs buried under raw tables
- Decisions stuck waiting for an analyst
- Inconsistent metric definitions across teams
With Wetrio
A dashboard built around the decision you need
- One screen, the right answer first
- Hierarchy that surfaces signal over noise
- Self-serve insight for non-analysts
- Shared metrics, defined once and trusted
A dashboard isn't successful when it's full — it's successful when it ends the meeting.
How it works
Decision-led. Data-true. Built to last.
You share the data context
Send us the dashboard goal, audience, data structure, examples, and key metrics.
We define the hierarchy
We identify what matters most, group the information, and plan the dashboard structure.
We design and refine
We create clear views, improve readability, and adjust the system based on feedback.
You get a dashboard that drives action
We deliver a clear analytics product with structured views and implementation-ready assets your team can use.
What our clients say
"The dashboard became much easier to read. The hierarchy is clearer now, and our team can find the key numbers without digging through everything."
Questions, answered.
Need more than just dashboards?
We also support teams with these services:
Ready to start?
Let's talk about
your project
Send us your project. We'll send back a quote, timeline, and plan.