Dashboards
What makes a good analytics dashboard — and what quietly ruins one
It fails one well-meaning addition at a time. Here is what a dashboard is actually for, and the six habits that quietly turn one into wallpaper.


Show a dashboard to the person who uses it and ask what they would do differently after reading it. If they cannot answer in a sentence, it is not a dashboard. It is a report with rounded corners.
Most are built backwards: start from the data that happens to exist, fit it all on one screen, wonder why nobody opens it twice. The better order is a person and a question — who reads this, and what will they do next. Everything on screen either serves that or leaves.
What it is actually for
Making a decision faster, not reporting everything measurable. A support lead wants to know whether response times are slipping before customers notice. A finance team wants to see whether spend tracks to plan. Those are different questions with different readers, and each deserves its own view — an executive and an analyst need different dashboards entirely. One screen serving everyone serves nobody.
Six habits that make one work
- Start from the decision and the reader, then build backwards.
- Lead with the number that matters — largest, first, before any supporting detail.
- Match the chart to the question: a trend is a line, a comparison is a bar, a status is often just a number.
- Practise restraint. If a metric changes no decision, it does not belong on the screen.
- Give every number context — a target, a trend, a comparison.
- Keep units, date formats and colour meanings identical throughout, at a size people can actually read.
Context is the one most often skipped, and it does the most damage. £120,000 in revenue means nothing alone. Against a £100,000 target it is a strong month. Against last month's £180,000 it is a problem. Same number, opposite meanings, decided entirely by what sits next to it.
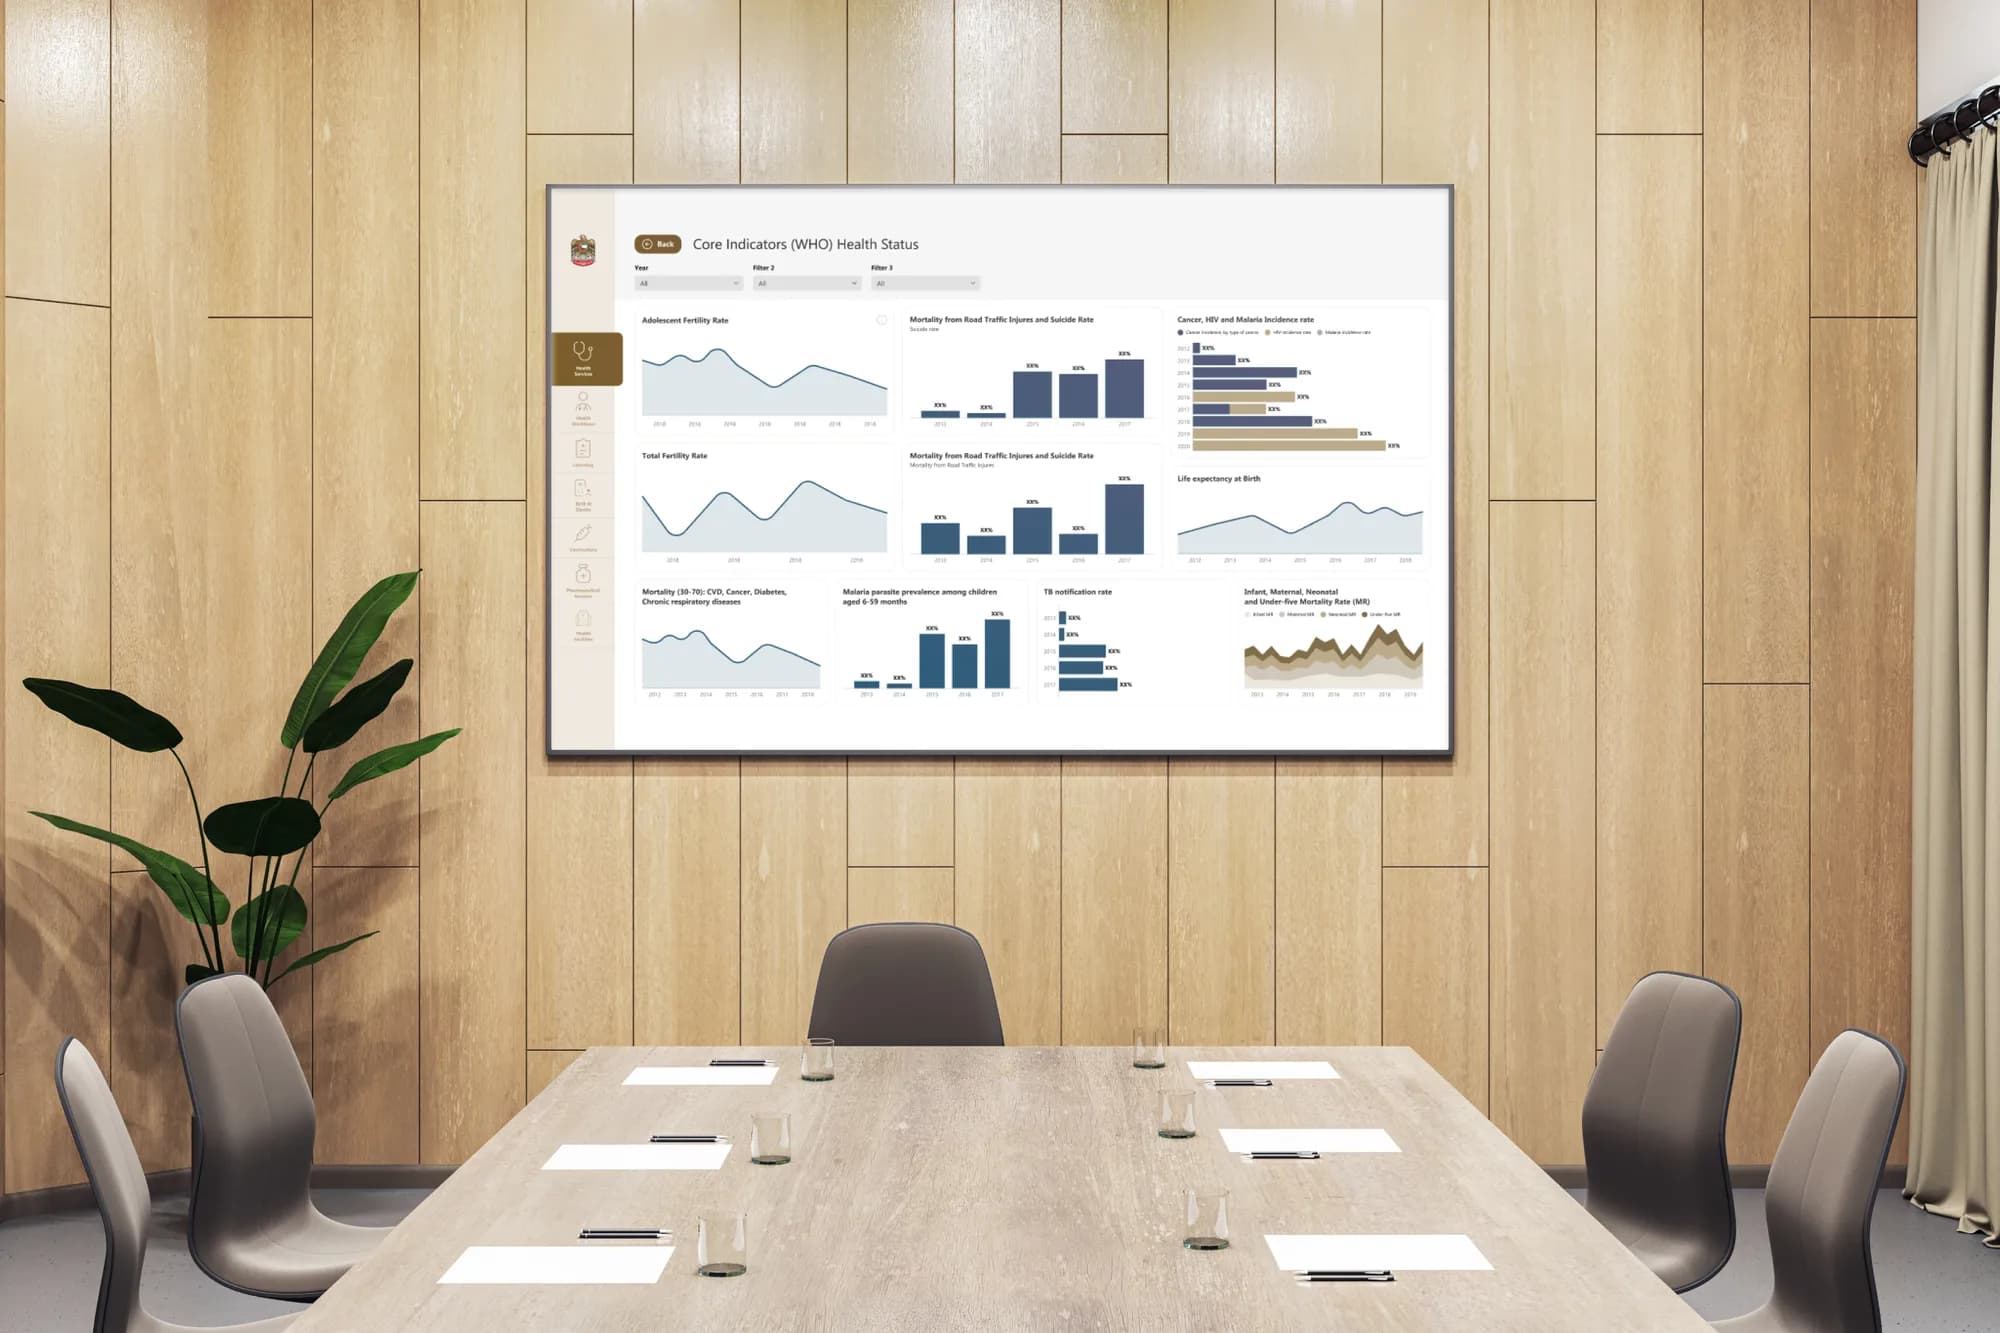
How they quietly go wrong
Dashboards rarely fail loudly. They fill up gradually, one reasonable request at a time, until nobody can find the number they came for.
- Every metric on one screen, so nothing is emphasised and everything must be hunted.
- Vanity metrics — total page views, cumulative sign-ups — crowding out figures that change decisions.
- Decoration over legibility: gradients and 3D effects making charts harder to read.
- No hierarchy, every element the same weight, the eye with nowhere to start.
- Unstated or mixed time ranges, so nobody knows what is being compared.
- Charts that mislead: truncated axes, pie charts with nine slices, dual axes implying a relationship that is not there.
That last one deserves real care, because a misleading chart is worse than no chart. An axis starting at eighty instead of zero turns a two percent move into a cliff. The data is accurate and the picture lies, and someone makes a confident decision on it.
None of this needs exotic tooling. It needs editing — cutting metrics, ordering what survives, labelling it honestly. That editing is the work, and it is what our dashboards and data design actually does.
A dashboard is finished not when there is nothing left to add, but when there is nothing left to remove without losing the answer.
Frequently asked questions
What makes a good analytics dashboard?
It answers one clear question for one reader at a glance and makes the next decision obvious. It starts from a decision someone has to make, then shows only what that decision requires.
Why is my dashboard hard to read?
Usually because it was built data-first: every metric on one screen, no hierarchy, no context. The fix is editing — lead with the number that matters, give each figure a comparison, cut anything that changes no decision.
How many metrics should a dashboard show?
As few as answer the question. It is finished when nothing can be removed without losing the answer.
Work with us
Need data that
drives decisions?
We design KPI dashboards and data products that surface what matters and let your team act fast.
Keep reading
All articles
Designing dashboards for executives vs analysts
One reader decides whether to act; the other needs to know why. Build one screen for both and you get a dashboard people screenshot instead of open.
Read article
Dashboards as narrative, not noise
The dashboards people actually open read like editorial: a headline, a paragraph, an argument. The ones nobody opens tried to show everything.
Read article
Why executives ignore your dashboard
It has every number they asked for. They look for eleven seconds and go back to phoning an analyst. The data is almost never the problem.
Read article